
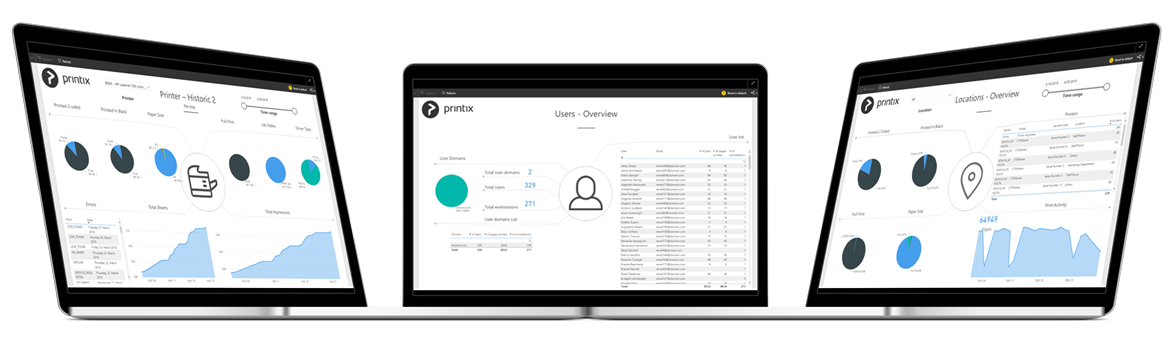
Once you have set up analytics, the Printix Power BI report provides a multi-perspective view into your Printix managed print environment.
The report has the following pages (or tabs):
- About the report
- Overview
- Printers – Overview
- Printer – History
- Printers – Service Status
- Job – History
- Locations – Overview
- Users – Overview
- User – Print Details
- User – Scan Details
- Workstations – Overview
- Workstations – Details
- Tree-O-Meter
- Cost
- Service Desk
Popular analysis
How to see who prints the most
- Open page Users – Overview.
How to see print costs
- Set up your own cost the first time you set up the report.
- Familiarize yourself with how the cost calculation is done.
- Open page Cost.
How to see when a user printed
- Open page Job – History.
- Select User.
How to see who printed on a specific printer
- Open page Job – History.
- Select Printer.
Post your comment on this topic.